Macro v micro
(Micro is mainly graphing)
- Macroeconomics: study of major components of the economy
Ex: inflation, GDP, and international trade.
- Microeconomics: the study of how households and firms make decisions and how they interact in markets
Ex: supply and demand, market structures
Positive economics v Normative economics
- positive economics: claims that attempt to describe the world as is. It is very descriptive (fact based)
Ex: minimum wage laws causes unemployment
- Normative economics: claims that attempt to prescribe how the world should be. It is very prescriptive in nature (opinion based)
Ex: the government should raise the minimum wage
Needs v wants
- Needs: basic requirements for survival
- wants: desire of decisions. They are broader than needs
Scarcity v shortage
- scarcity: the most fundamental economic problem facing all societies. Satisfying unlimited wants with limited resources. (More permanent)
Ex: oil
- shortage: where quantity demanded is greater than quantity supplied. (Temporary)
Elasticity of Demand
Tells how drastically buyers will cut back or increase their demand for a good when the prices rises or falls.Elastic demand
When demand will change greatly given a small change in price. (Wants)
Inelastic demand
Your demand for a product will not change regardless of price. ( Needs
Unelastic demand
Equals to one1.New quantity-old quantity/ old quantity
2.New price-old price/ old price
3. PED
Equilibrium
The point at which the supply curve and demand curve intersect. The point that they insect at means that an economy is using their resources efficiently.Shortage- QD>QS
Surplus- QS>QD
Price ceiling
Government imposed limit on how high you can be charged or service.
Price Flooring
Government imposed minimum on how low a price can be charged for a service.

Shortage - Quantity Demanded > Quantity Supply
Surplus - Quantity Supply > Quantity Demanded
Goods & Services
Goods - Tangable Comodities
Factors of Production

How we use our resources -
Trade-offs - Alternatives that we give up that when we choose one course of action over another.
Opportunity costs - most desirable alterntive given up by making a decision
Production Possibility Graph - Shows alternative ways to use resources.
 Production Possibility Graph Key Assumptions
A - Underutilized, is attainable but inefficient. (ex. not enough employees to serve a plethora of customers)
B - Efficient but produces more guns
C- Efficient but produces more butter
D - Efficient and Attainable (Ideal Ecnomics)
X - Efficient but unattainable (usually during war or famine)
Goods - Tangable Comodities
- Consumer Goods - Goods that are intended for final use by consumer
- Capital Goods - Goods that are used in the creation of other goods
Factors of Production
How we use our resources -
Trade-offs - Alternatives that we give up that when we choose one course of action over another.
Opportunity costs - most desirable alterntive given up by making a decision
Production Possibility Graph - Shows alternative ways to use resources.
- Two goods are produced
- Full Employment
- Fixed Resources (land, labor, capital, entrepreneurship)
- Fixed state of technology
- No international trade
A - Underutilized, is attainable but inefficient. (ex. not enough employees to serve a plethora of customers)
B - Efficient but produces more guns
C- Efficient but produces more butter
D - Efficient and Attainable (Ideal Ecnomics)
X - Efficient but unattainable (usually during war or famine)
Demand

Demand is the quantities that people are willing and able to buy at various prices
The law of demand: There is an inverse relationship between price and quantity demanded
What causes a "change in quantity demanded"?
Δ in price
What causes a "change in demand"? (ΔD)
1. Δ in buyer's taste (advertising)
2. Δ in # of buyers (population)
3. Δ in income
-normal goods: goods buyers buy more when income rises
-inferior goods: goods buyers buy less of when income rises
4. Δ in price of related goods
-substitute goods: goods that serve roughly the same purpose to buyers
Ex. Coca cola and Pepsi
-complimentary goods: goods that are consumed together
5. Δ in expectations (thinking of future)
Elasticity of demand: tells how drastically buyers will cut back or increase their demand for a good when the price rises or falls
-elastic demand: demand will change greatly given a small change in price (wants) E > 1
Ex. Movie tickets, steak, fur coats
-inelastic demand: your demand for a product will not change regardless of price (needs) E < 1
Ex. Milk, gasoline, medicine (insulin)
-unit-elastic: E=1
Supply
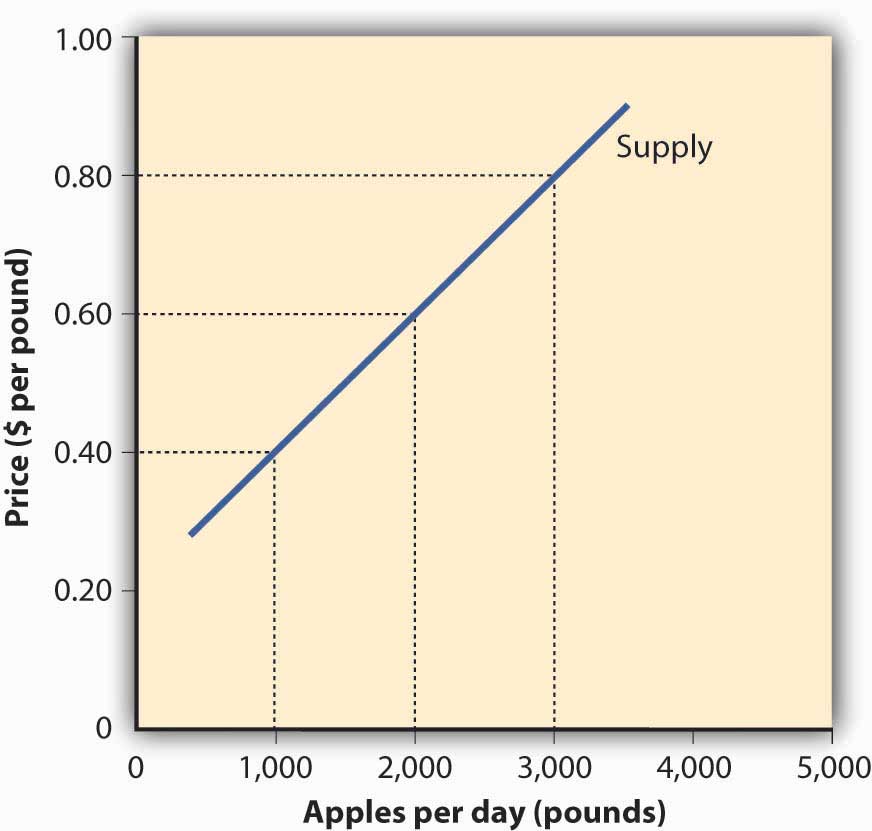
Supply
Supply is quantities that producers or sellers are willing and able to produce or sell at various prices
The Law of Supply states that there is a direct relationship between price and quantity supply
Δ in price causes a Δ in quantity supplied
There are 6 things that causes a Δ in supply
1. Δ in weather
2. Δ in technology
3. Δ in taxes/subsidies
4. Δ in cost of production
5. Δ in # of sellers
6. Δ in expectations