Thursday, May 14, 2015

Foreign Exchange Market and International Trade Notes

Foreign Exchange

  • It is the buying and selling of currency.
  • The exchange rate (e) is determined in the currency markets
    • Current exchange is 77 Japanese Yen to 1 dollar.
  • The exchange rate is the price of a currency.
  • Do not try to calculate the exact exchange rate.
Tips
  • Always change the D line on the one currency graph, the s libe on the other's currency graph
  • Move the lines of the two currency graphs i the same direction (right or left) and you will have the correct answer
  • If D on one graph increases, S on the other will increase too
  • If D moves left to the left, S will move to the left on the other graph.
Changes in the Exchange Rate
  • Exchange rates (e) are a function of the supply and demand for currency.
    • An increase in the supply of a currency will make it cheaper to buy one unit of that currency.
    • A decrease in supply of a currency will make it more expensive to buy one unit of that currency.
    • An increase in the demand of a currency will make it more expensive to to buy one unit of that currency.
    • A decrease in demand of a currency will make it cheaper buy one unit of that currency.

Dollar Market Graph


Appreciation

  • Appreciation of a currency occurs when the exchange rate of that currency increases.
    • 100 Yen used to buy $1, now 200 Yen buys $1
    • The dollar is stronger because one buys more Yen than it used to.
Depreciation
  • Occurs when the exchange rate of that currency decreases
    • 100 Yen used to buy $1 now 50 Yen buy $1
    • The dollar is weaker because it takes fewer Yen to buy one dollar.
International Trade
Purchasing Power Parity

  • When currency rate are set by international market, changes will be based o the purchasing power of the currency
  • If US dollar to the European Euro is 1.5 to 1, then each $1.50 will buy one euro. However if a item in US cost a $1.50 and then cost more or less than one euro, the parity is lost.
  • Markets will adjust quickly in floating rates or pressure for change will occur in fixed rates.
Why do we exchange currencies?
  • To sell export and buy imports.
  • To invest in another country's stocks and bonds.
  • To build stores or factories in another country.
  • To speculate on currency values
  • To hold currencies in bank accounts for future exports, imports and business loans.
  • To control excessive imbalances.

Unit 7 Notes


Balance of Payments


  • Measure of money inflows and outflows between the US and the rest of the world (ROW)
    • Inflows: Credit *adding
    • Outflows: Debits *taking
  • The balance of payments is divided into 3 accounts
    • Current Account
    • Capital/Financial Account
    • Official Reserves Account
Double Entry Bookkeeping
  • Every transaction in the balance of payment is recorded twice in accordance with standard accounting practice
    • Ex: US manufacturer John Deere exports $50 million worth of farm equipment to Ireland
      • A credit of $50 million to the current account 
      • A debit of $50 million to capital/financial
Current Account

  • Balance of trade or net exports
    • Exports of goods/services -import of goods/service
    • Exports create a credit to the balance of payments
    • Imports create a debit to the balance of payments
  • Net Foreign Income
    • Income earned by US owned foreign assets - Income paid to foreign held US assets
    • Ex: Interest Payments on US owned Brazilian bonds - Interest payments on German owned US Treasury bonds.
  • Net Transfers (tend to be unilateral)
    • Foreign Aid -> A debit to the current account
    • Ex: Mexican migrant workers send money to family in Mexico
Capital/Financial Account
  • The balance of capital ownership
  • Includes the purchase of both real and financial assets
  • Direct Investment in the US is a credit to the capital account
    • Ex: The Toyota Factory in San Antonio
  • Direct investment by US firms/individuals in a foreign country are debits to the capital account
    • Ex: The Intel Factory in San Jose, Costa Rica
  • Purchase of foreign financial assets represents a debit to the capital account
    • Ex: Warren Buffet buys stock in Petrochina
  • Purchase of domestic financial assets by foreigners represents a credit to the capital account.
    • The United Arab Emirates sovereign wealth fund purchase a large stake in the NASDAQ
Relationship between Current and Capital Account
  • The current Account and the Capital Account should zero each other out.
  • That is if the Current Account has a  negative balance (deficit), then the Capital Account should than have a positive balance (surplus)
  • Example: The constant net inflow of foreign financial capital to the United States (capital account) is what enables us to import more than we export(current account deficit)
  • Official Reserves
    • The foreign currency holdings of the United States Federal Reserves System
    • When there is a balance of payments surplus the Fed accumulates foreign currency ad debits the balance of payments.
    • When there is a balance of payments deficit the Fed depletes its reserves of foreign currency and credits the balance of payments.
    Active v. Passive Official Reserves
    • The United States is passive in its use of official reserves. It doesn't seek to manipulate the dollar exchange rate.
    • The People's Republic of China is active in its use of official reserves. It actively buys and sells dollars in order to maintain a steady exchange rate with the United States.

Unit 5 Notes

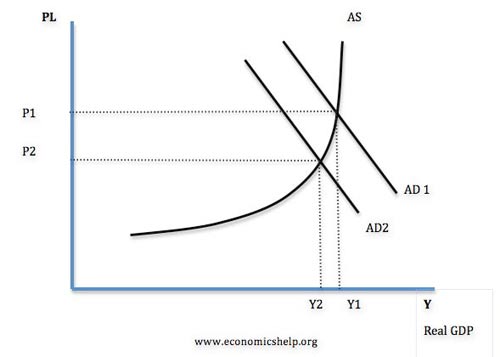
Relating Phillips Curve to AS/AD
  • Changes in the AS/Ad model can also be seen in the Phillips Curves
  • Almost like mirror images
  • Two models are not equivalent. The AS/AD model is static but the Philips Curve includes changes over time, while the AS/AD shows one time changes in the price level as inflation or deflation. 
  • The Phillips curve illustrates continuous change in the price-level as either increased inflation or disinflation .

Stagflation: rising inflation and rising unemployment
  • Civil right movement
  • Women's movement
  • Baby boom 1946 1964
  • When Vietnam ended
  • Embargo 1973 - 1979

Disinflation
  • Reduction in inflation rate from year to yer which is usually displayed in the LRPC
  • This occurs when AD declines
  • In short run profits fall and the unemployment rate increases

Deflation
  • Actual drop in the price level

Laffer Curve
Supply side economics

  • Supply side economist tend to believe that the AS curve will determine levels of inflation, unemployment and economic growth
  • To increase the economy, you take action to shift the AS curve to the right, always benefitting the company first. 
  • Focus on marginal tax rate ( amount paid on the last dollar earned or on each additional dollar)
  • Reduction in marginal tax rate, you encourage more people to work longer in which they would for go their leisure time for extra income.
  • Lowered taxes are an incentive for businesses to invest in our economy.
  • Lowered taxes are incentives for people to increase savings and therefore create lower interest rates for increases in business investments.
  • Reaganomics: lowered marginal tax rate to get US out of recession and caused a deficit.
Laffer Curve
It is a trade off between tax rates and goverment revenue 
Used to support the supply side argument
As tax rates increase from 0, tax revenues increase from 0 to some maximum level and then decline.

Criticisms of the Laffer Curve 
Research suggests that the impact on tax rates on incentives to work, save and invest are small.
Tax cuts also increase demand which can fuel inflation which will cause demand to exceed supply.
Where the economy is actually located on the curve is difficult to determine.


Sunday, March 29, 2015

Relating the Money Market, Loanable Funds Market, and AD-AS

AP Macroeconomics Unit 4 Part 9

The first two graphs, are the same as before, and should be labeled exactly the same. For the AD-AS graph, the y-axis should be labeled as price level and the x-axis should be labeled as GDP. To show a change through the money market graph all the way over to the AD-AS graph, you must start at the money market graph. 
If there is an increase in demand for money, the interest rate will boost up. You can show that on the loanable funds graph in two ways. There can either be an increase in demand for loanable funds or reduce the supply of loanable funds. Say you use the idea to increase the demand for loanable funds, the graph would shift to the right and the interest rate and equilibrium would be the same for the two graphs. An increase in government spending will increase aggregate demand. An increase in AD also increases the price level and GDP. 

Money Creation and Multiple Deposit Expansion

AP Macroeconomics Unit 4 Part 8
              Banks create money by making loans. To calculate how much money is created, you must know use the money multiplier, which is 1/ Required Reserves. If a loan is given out at the amount of $500 and the required reserve is at 20%, you would first use the money multiplier. Plug in 1/ .20 which equals 5 and multiply that by the amount of loans, $500. The amount of money created is $2,500. One thing to remember is, just because the bank loans out $500, it is not guaranteed to increase into $2,500. Banks can hold their excess reserves and prevent the increase of money.

Saturday, March 28, 2015

The Loanable Funds Market

AP Macroeconomics Unit 4 Part 7
               First when making your graph, label the axis. Your y-axis should be labeled as interest rate. On the x-axis, it should be labeled as quantity of loanable funds. The demand for loanable funds is downward sloping, because when interest rate is lower, people demand for more money and when the interest rate is higher, people have a disincentive to borrow. The supply for loanable funds slope is upward sloping.
             The supply of loanable funds come from the amount of money people have in banks, which means that it is dependent on savings. If people have incentives to save more, the supply of loanable funds increases and shifts to the right and if the incentive is to save less, the supply of loanable funds would shift to the left. When the demand for money goes up, it is best to increase the demand for loanable funds so the equilibrium will be the same. To shift the demand curve for an increase, you would move it to the right and for a decrease the curve will be shifted to the left.

The Fed's Tools of Monetary Policy

AP Macroeconomics Unit 4 Part 4
           Expansionary: (Easy Money). The Fed can lower the reserve requirement, which means that money that was required reserves becomes excess reserves so the bank can make loans. If the Fed wants the banks to borrow more money, they would lower the discount rate. To expand the money supply, the Fed will buy bonds.
          Contractionary: (Tight Money). The Fed can raise the reserve requirement, which means that they take the banks excess reserves and makes them required reserves. If the Fed wants to discourage banks from borrowing money, they would raise the discount rate. To reduce the money available in the money supply, the Fed will sell bonds.

Money Market Graphs

AP Macroeconomics Unit 4 Part 3
          First, when making your graph you must label your axis. Starting with the y-axis which should be labeled interest rate. On the x-axis, it should be labeled quantity of money.  Demand for money is downward sloping, because when price is high the quantity demanded is low and when the price is low the quantity demanded is high. The supply of money is vertical, because it does not vary based on the interest rate. The supply of money is fixed and set by the Fed.
        When demand for money increases the graph is shifted to the right and when the demand for money decreases the graph shifts to the left, not up or down. When this happens, quantity does not change, because supply is vertical. If the Fed does not want to have high interest rates, they can just increase the money supply and bring it back down. A shift of the money supply to the right would stabalize interest rates.

Types and Functions of Money

AP Macroeconomics Unit 4 Part 1
            There are three different types of money; Commodity, Representative, and Fiat. Commodity money is goods that also function as money, an example is, tribes in Africa using cows as a form of payment. Representative money means that the currency is represented by a quantity of a precious metal. Fiat money is a promise by the government that the currency has value. 
           There are also three function of money; a medium of exchange, store of value, and unit of account. Medium of exchange is buying or selling goods and services. Store of value means that when someone puts money in the bank, it should retain its value. Unit of account means that the price of a product determines its value.

Saturday, February 7, 2015

Inflation and Unemployment

Inflation
·         Inflation – rise of general level of prices
·         Inflation rate – measures percentage in the price level over time. Key indicator of the economy’s health.
·         Deflation – decline in general price level.
·         Disinflation – when the inflation rate declines.
·         CPI – measures inflation by tracking yearly price of a fixed basket of goods and services. Indicates changes in cost of living and price level.
·         Rule of 70 – used to calculate number of years it would take for a price level to double at any given rate.
·         Real interest rate – unadjusted cost of borrowing or lending money.
·         Demand pull inflation – caused by an excess of demand over output that pulls prices upward.
·         Cost push inflation – caused by rise in per unit production cost due to increasing resource cost.
·         Hurt by inflation – Fixed income, lenders, creditor’s, savers

·         Help by inflation – borrowers 


Unemployment
·         Unemployment – percentage of people who do not have a job but are in the labor force.
·         Labor force – number of people in a country that are classified as employed or unemployed.
·         Not in Labor Force – kids, military personnel, mentaly insane, prisoner, retirees, stay at home parents, the discouraged
·         Unemployment rate – number of unemployed/ number of unemployed + number of employed *100. 4-5% standard rate.
·         Frictional – between jobs. Quit job looking for a better one. Graduating college looking for a job.
·         Structural – associated with a lack of skills or a declining industries. High school dropout who can’t read or write. Technology changes.
·         Seasonal- school bus drivers, life guards, construction workers.
·         Cyclical – associated with downturns in the business cycle. Bad for society and individuals.
·         Full employment – occurs when there is no cyclical unemployment present in the economy.
·         Natural rate of unemployment – 4-5%
·         Bad unemployment – not enough consumption (GDP), creates too much poverty, creates too much government assistance.
·         Good unemployment – less pressure to raise wages, more workers or future expansions.

·         Okun’s Law – for every 1% of unemployment above natural rate of unemployment causes a 2% decline in real GDP.

GDP Notes

GDP and GNP
·         Economists collect statistics on production, income, investment, and savings. This is called national income average.
·         Most Important Measures of growth is GDP.
·         GDP – Total dollar value of all final goods and services produced within a countries borders within a given year.
·         GNP – total value of all final goods and services by citizens of that country on its land or on foreign land.
·         Not included in GDP
a)    Intermediate goods – no multiple counting, only final goods.
b)    Second hand or used goods
c)    Non market activity – illegal drugs, babysitting, volunteering, etc.
d)    Final transaction – stocks, bonds, real-estate.
e)    Gifts
f)     Transfer Payments – Social security, scholarships
·         Included in GDP
a)    Consumption – 67% of economy. All finished goods/services.
b)    Gross Private Domestic Investment – New factory equipment, construction of housing, factory equipment maintenance, unsold inventory products built in a year.
c)    Government Spending – anytime the government purchases goods and services.
d)    Net Exports = Exports – Imports

Expenditure Approach to GDP
·         Add up the market value of all domestic expenditures made on final goods and services in a single year.
·         Expenditure Approach – C+Ig+G+Xn= GDP
·         Add up all income earned by households and firms in a single year.
·         Income Approach – W+R+I+P+ Statistical adjustments= GDP
·         Wages – Compensation of employees. Salary supplements.
·         Rents – Tenants to landlords, lease payments by a corporation for a use of their space.
·         Interest – money paid by private businesses to the suppliers of loans used to purchase capital.
·         Profit – corporate income taxes, dividends, undistributed corporate profits.
·         Budget – government purchases of goods and services + government transfer payments – government tax and fee collection. Positive number is budget deficit, negative number is budget surplus.
·         Trade – exports – imports. Negative number is trade deficit, positive number is trade surplus.
·         GNP – GDP+ net foreign factor income
·         NNP – GNP – Depreciation
·         NDP – GDP – depreciation
·         National Income – GDP – indirect business taxes- depreciation- net foreign factor payments
Or
Compensation of employees + proprietors income + corporate profits +rental income+ Interest income
·         Disposable Income – NI – personal household taxes + government transfer payments

Nominal GDP Vs. Real GDP

·         Nominal GDP – Value of output produced in current prices. Can increase from year to year if output or price increase.
·         Real GDP – Value of output produced in constant or base year prices. Adjusted for inflation. It can only increase from year to year if output increases.
·         Formula – Price * Quantity
·         Price Index – measures inflation in the market basket of goods compared with that in base year. Price Market of goods in current year/ price market of goods in base year * 100
·         GDP Deflator – price index used to adjust from nominal to real GDP. Nominal GDP/ Real GDP * 100
·         In base year GDP deflator is always equal to 100. For years after the base years, the GDP deflator is greater than 100. For years before base year the GDP deflator is less than 100.
·         Inflation rate – New – old/old *100


Thursday, January 22, 2015

Notes

Macro v micro
(Micro is mainly graphing) 
- Macroeconomics: study of major components of the economy
Ex: inflation, GDP, and international trade.
- Microeconomics: the study of how households and firms make decisions  and how they interact in markets
Ex: supply and demand, market structures

Positive economics v Normative economics
- positive economics: claims that attempt to describe the world as is. It is very descriptive (fact based)
Ex: minimum wage laws causes unemployment
- Normative economics: claims that attempt to prescribe how the world should be. It is very prescriptive in nature (opinion based)
Ex: the government should raise the minimum wage

Needs v wants
- Needs: basic requirements for survival
- wants: desire of decisions. They are broader than needs

Scarcity v shortage
- scarcity: the most fundamental economic problem facing all societies. Satisfying unlimited wants with limited resources. (More permanent)
Ex: oil
- shortage: where quantity demanded is greater than quantity supplied. (Temporary)


Elasticity of Demand

Tells how drastically buyers will cut back or increase their demand for a good when the prices rises or falls.

Elastic demand
When demand will change greatly given a small change in price. (Wants)

Inelastic demand
    Your demand for a product will not change regardless of price. ( Needs
   

Unelastic demand

   Equals to one

1.New quantity-old quantity/ old quantity
2.New price-old price/ old price
3. PED


Equilibrium

The point at which the supply curve and demand curve intersect. The point that they insect at means that an economy is using their resources efficiently.

Shortage- QD>QS
 Surplus- QS>QD
  

Price ceiling

Government imposed limit on how high you can be charged or service. 


Price Flooring
Government imposed minimum on how low a price can be charged for a service.


Shortage - Quantity Demanded > Quantity Supply
Surplus - Quantity Supply > Quantity Demanded

Goods & Services

Goods - Tangable Comodities 
  • Consumer Goods - Goods that are intended for final use by consumer
  • Capital Goods - Goods that are used in the creation of other goods
Services - Work that is performed for some else

Factors of Production 

How we use our resources -

Trade-offs - Alternatives that we give up that when we choose one course of action over another.

Opportunity costs - most desirable alterntive given up by making a decision

Production Possibility Graph - Shows alternative ways to use resources.
 Production Possibility Graph Key Assumptions
  1. Two goods are produced
  2. Full Employment
  3. Fixed Resources (land, labor, capital, entrepreneurship)
  4. Fixed state of technology
  5. No international trade
Points on the graph

A - Underutilized, is attainable but inefficient. (ex. not enough employees to serve a plethora of customers)
B - Efficient but produces more guns
C- Efficient but produces more butter
D - Efficient and Attainable (Ideal Ecnomics)
X - Efficient but unattainable (usually during war or famine)
Demand


Demand is the quantities that people are willing and able to buy at various prices
The law of demand: There is an inverse relationship between price and quantity demanded
What causes a "change in quantity demanded"?
Δ in price
What causes a "change in demand"? (ΔD)
1. Δ in buyer's taste (advertising)
2. Δ in # of buyers (population)
3. Δ in income 
 -normal goods: goods buyers buy more when income rises
 -inferior goods: goods buyers buy less of when income rises 
4. Δ in price of related goods
 -substitute goods: goods that serve roughly the same purpose to buyers
Ex. Coca cola and Pepsi
 -complimentary goods: goods that are consumed together
5. Δ in expectations (thinking of future)

Elasticity of demand: tells how drastically buyers will cut back or increase their demand for a good when the price rises or falls
 -elastic demand: demand will change greatly given a small change in price (wants) E > 1
Ex. Movie tickets, steak, fur coats
 -inelastic demand: your demand for a product will not change regardless of price (needs) E < 1
Ex. Milk, gasoline, medicine (insulin)
 -unit-elastic: E=1

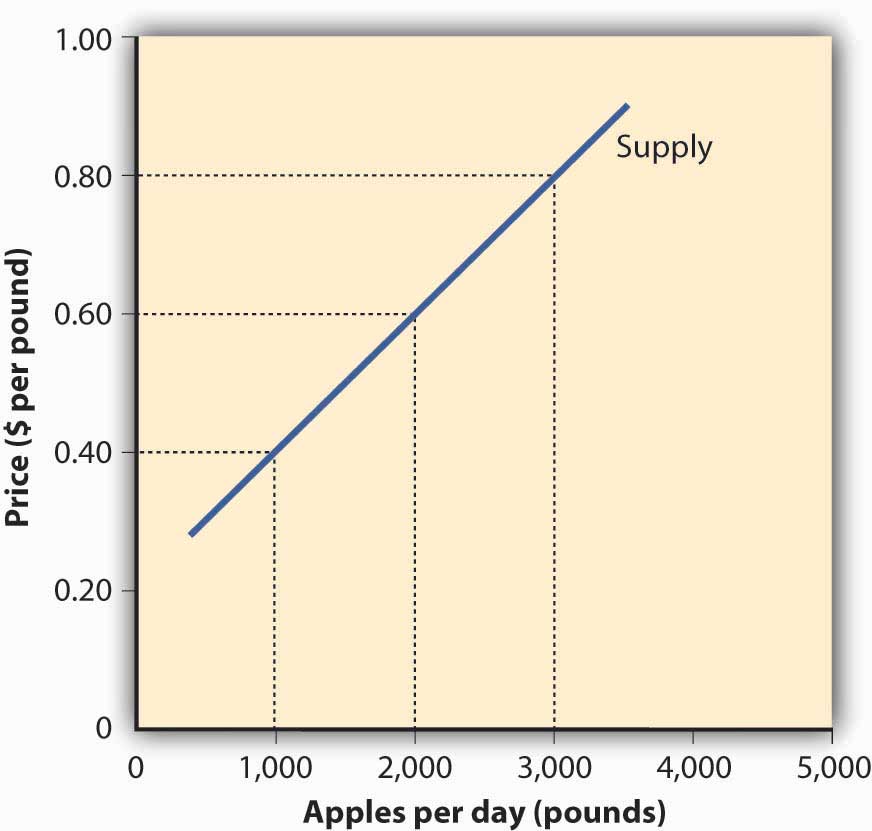
Supply

Supply is quantities that producers or sellers are willing and able to produce or sell at various prices
The Law of Supply states that there is a direct relationship between price and quantity supply
Δ in price causes a Δ in quantity supplied
There are 6 things that causes a Δ in supply
1. Δ in weather
2. Δ in technology
3. Δ in taxes/subsidies
4. Δ in cost of production
5. Δ in # of sellers
6. Δ in expectations