AP Macroeconomics Unit 4 Part 9


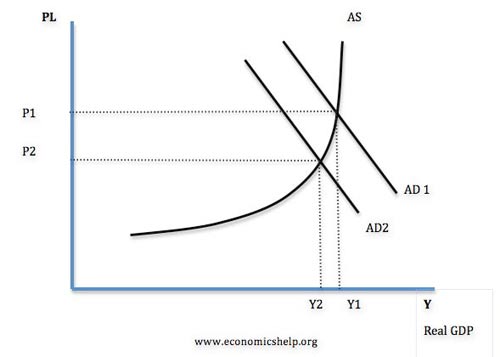
The first two graphs, are the same as before, and should be labeled exactly the same. For the AD-AS graph, the y-axis should be labeled as price level and the x-axis should be labeled as GDP. To show a change through the money market graph all the way over to the AD-AS graph, you must start at the money market graph.
If there is an increase in demand for money, the interest rate will boost up. You can show that on the loanable funds graph in two ways. There can either be an increase in demand for loanable funds or reduce the supply of loanable funds. Say you use the idea to increase the demand for loanable funds, the graph would shift to the right and the interest rate and equilibrium would be the same for the two graphs. An increase in government spending will increase aggregate demand. An increase in AD also increases the price level and GDP.
No comments:
Post a Comment