Sunday, March 29, 2015

Relating the Money Market, Loanable Funds Market, and AD-AS

AP Macroeconomics Unit 4 Part 9

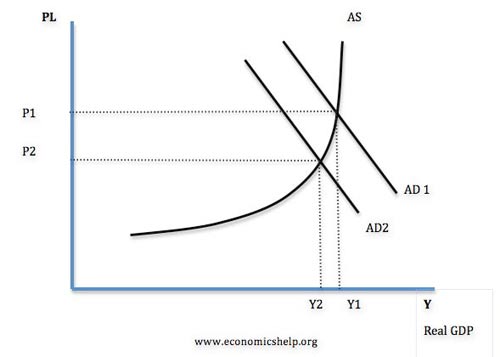
The first two graphs, are the same as before, and should be labeled exactly the same. For the AD-AS graph, the y-axis should be labeled as price level and the x-axis should be labeled as GDP. To show a change through the money market graph all the way over to the AD-AS graph, you must start at the money market graph. 
If there is an increase in demand for money, the interest rate will boost up. You can show that on the loanable funds graph in two ways. There can either be an increase in demand for loanable funds or reduce the supply of loanable funds. Say you use the idea to increase the demand for loanable funds, the graph would shift to the right and the interest rate and equilibrium would be the same for the two graphs. An increase in government spending will increase aggregate demand. An increase in AD also increases the price level and GDP. 

Money Creation and Multiple Deposit Expansion

AP Macroeconomics Unit 4 Part 8
              Banks create money by making loans. To calculate how much money is created, you must know use the money multiplier, which is 1/ Required Reserves. If a loan is given out at the amount of $500 and the required reserve is at 20%, you would first use the money multiplier. Plug in 1/ .20 which equals 5 and multiply that by the amount of loans, $500. The amount of money created is $2,500. One thing to remember is, just because the bank loans out $500, it is not guaranteed to increase into $2,500. Banks can hold their excess reserves and prevent the increase of money.

Saturday, March 28, 2015

The Loanable Funds Market

AP Macroeconomics Unit 4 Part 7
               First when making your graph, label the axis. Your y-axis should be labeled as interest rate. On the x-axis, it should be labeled as quantity of loanable funds. The demand for loanable funds is downward sloping, because when interest rate is lower, people demand for more money and when the interest rate is higher, people have a disincentive to borrow. The supply for loanable funds slope is upward sloping.
             The supply of loanable funds come from the amount of money people have in banks, which means that it is dependent on savings. If people have incentives to save more, the supply of loanable funds increases and shifts to the right and if the incentive is to save less, the supply of loanable funds would shift to the left. When the demand for money goes up, it is best to increase the demand for loanable funds so the equilibrium will be the same. To shift the demand curve for an increase, you would move it to the right and for a decrease the curve will be shifted to the left.

The Fed's Tools of Monetary Policy

AP Macroeconomics Unit 4 Part 4
           Expansionary: (Easy Money). The Fed can lower the reserve requirement, which means that money that was required reserves becomes excess reserves so the bank can make loans. If the Fed wants the banks to borrow more money, they would lower the discount rate. To expand the money supply, the Fed will buy bonds.
          Contractionary: (Tight Money). The Fed can raise the reserve requirement, which means that they take the banks excess reserves and makes them required reserves. If the Fed wants to discourage banks from borrowing money, they would raise the discount rate. To reduce the money available in the money supply, the Fed will sell bonds.

Money Market Graphs

AP Macroeconomics Unit 4 Part 3
          First, when making your graph you must label your axis. Starting with the y-axis which should be labeled interest rate. On the x-axis, it should be labeled quantity of money.  Demand for money is downward sloping, because when price is high the quantity demanded is low and when the price is low the quantity demanded is high. The supply of money is vertical, because it does not vary based on the interest rate. The supply of money is fixed and set by the Fed.
        When demand for money increases the graph is shifted to the right and when the demand for money decreases the graph shifts to the left, not up or down. When this happens, quantity does not change, because supply is vertical. If the Fed does not want to have high interest rates, they can just increase the money supply and bring it back down. A shift of the money supply to the right would stabalize interest rates.

Types and Functions of Money

AP Macroeconomics Unit 4 Part 1
            There are three different types of money; Commodity, Representative, and Fiat. Commodity money is goods that also function as money, an example is, tribes in Africa using cows as a form of payment. Representative money means that the currency is represented by a quantity of a precious metal. Fiat money is a promise by the government that the currency has value. 
           There are also three function of money; a medium of exchange, store of value, and unit of account. Medium of exchange is buying or selling goods and services. Store of value means that when someone puts money in the bank, it should retain its value. Unit of account means that the price of a product determines its value.